
Situation
The business had a large base of users with very different patterns of activity, value, promotional response, and recency. Teams could see aggregate performance, but the operating categories were still too blunt: active or inactive, high value or low value, engaged or at risk.
That made decisions harder than they needed to be. Growth, retention, product, and analytics teams needed a segmentation model that was not just statistically valid, but explainable enough to use in planning, outreach, and performance reviews.
What changed
The work started by translating raw behavior into feature groups that business teams could understand. The model used recent activity, transaction value, recency and frequency, performance patterns, and promotional engagement over a 90-day window.
- Engineered feature groups for engagement, transaction value, recency, frequency, promotional usage, and performance signals.
- Reduced the raw variables into interpretable components such as activity frequency, session intensity, pacing, promotional engagement, monetary tempo, and monetary magnitude.
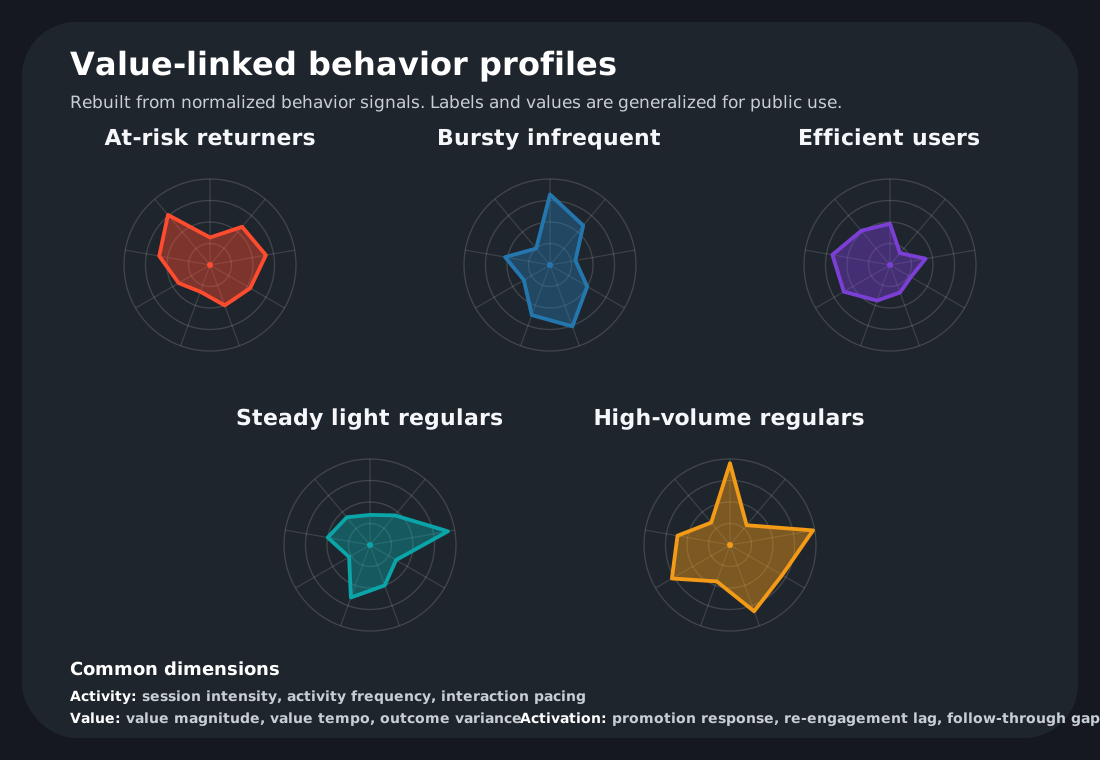
- Applied unsupervised clustering to produce five behavior profiles that teams could describe, compare, and act on.
- Connected each segment to value concentration so leaders could see which user groups required different growth, retention, or product actions.
What held up afterward
The practical value came from making the segments legible. Teams could see how at-risk, bursty, efficient, steady, and high-volume profiles behaved differently, then pair those profiles with value concentration, retention needs, and outreach decisions.
The segmentation gave teams a shared language for user behavior. Instead of debating broad averages, they could talk about specific profiles, what made them different, and which actions were worth testing for each one.
Segmentation is useful when the profiles are explainable and tied to decisions. A mathematically clean cluster that no one can act on is still just an analysis artifact.